Nerd alert: This is the second article of a two-part series (see the first here). It’s a bit heavier on the statistical vocabulary than other posts on this blog.
The Green Sleeper Hit

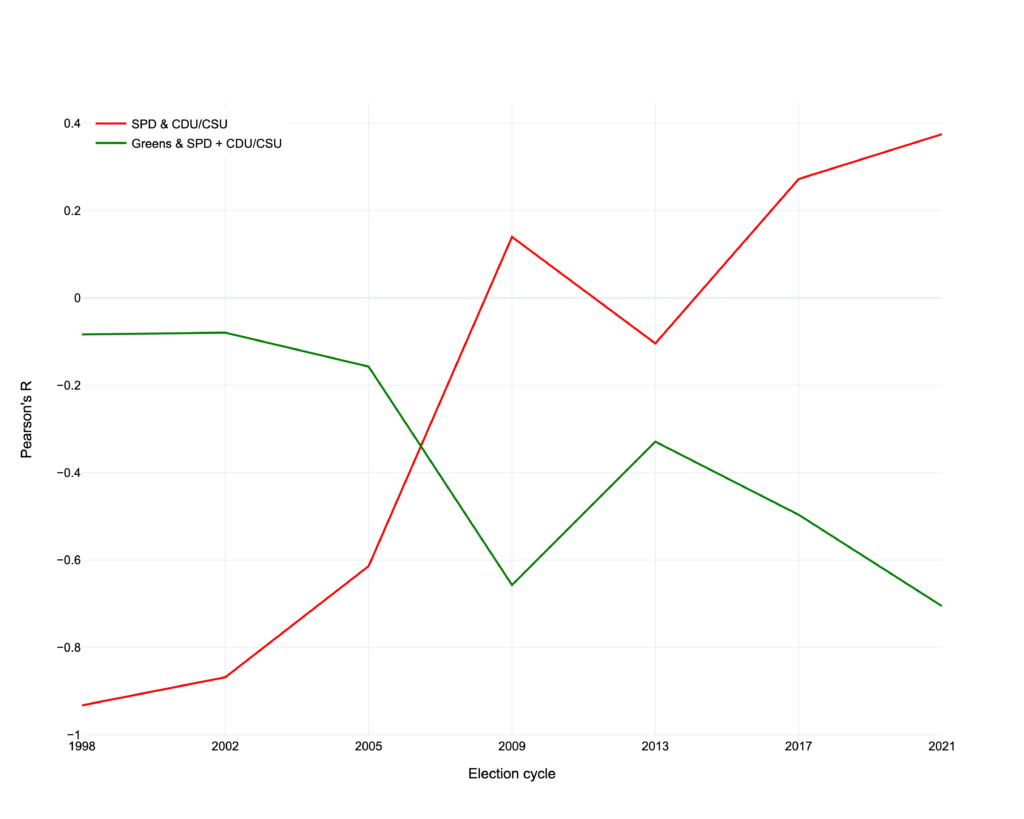
If you’ve already read part 1, you’ve seen this chart. If not, take five and go give it a read. For this second part, we’re going to focus on the green line which, as you’ll notice, goes down with almost every election cycle.
Here’s a quick recap on how to read the chart:
The chart above shows how the polling average of the SPD, CDU/CSU and the Greens are correlated. The X axis is the election cycle, denoted by the year the election took place in. The Y axis is a value called Pearson’s R. Pearson’s R goes from -1 to 1 and denotes whether two things are positively or negatively correlated. For the context of German politics, this means: the higher up a number on the Y axis is, the more those parties’ numbers move in tandem. The lower it gets, the more they move in the opposite direction.
It’s a good time to be green

Looking at the chart above, it’s not hard to tell the macro story of the 2021 election cycle. After 27 years, Die Grüne, Germany’s Green party, have now become the second-most popular party in Germany. It’s plausible and realistic to imagine Germany, the country famous for building cars and being boringly predictable, having a green chancellor (not in this election, though).
I’d understand if after a quick glance at the data from this election cycle, you’d surmise that this all happened in the span of 3.5 years. You (and a lot of professional news commentators) would be missing two insights though:
- The Greens actually became the de-facto main opposition party back in 2010
- The Greens’ main source of strength are SPD voters and not CDU/CSU voters
When the Greens first found their groove
You can see the beginnings of the Green party’s evolution to becoming the main alternative to the Christian Democrats in the 2013 election cycle. This cycle is the only one where Angela Merkel was chancellor and her party was not in a coalition with the SPD, traditionally the ying to the CDU/CSU’s yang.
If the SPD would have had a chance to recover from being perceived as too close to their center right rivals, it would have been during this time. Looking at the way both parties’ popularity is measured in polls during this time, we can see that they have an R value of -0.1. This basically means that their movement is not really correlated.
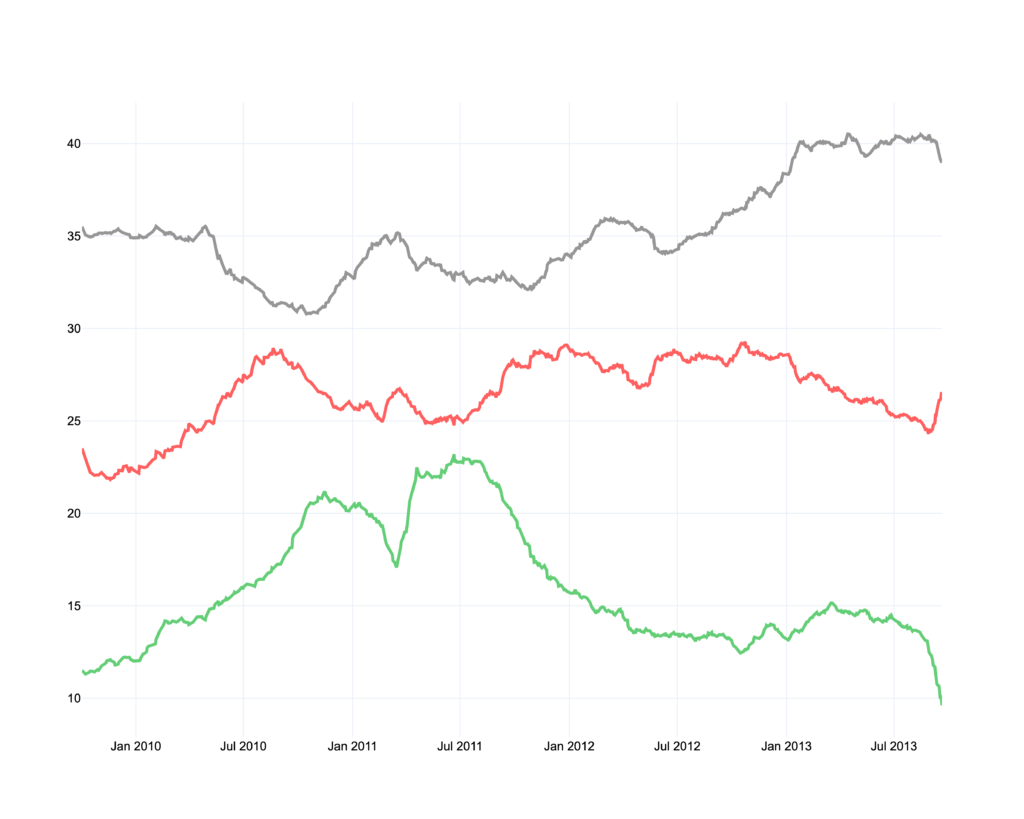
In stark contrast to that, the Greens’ correlation to the Christian Democrats during that same period registered at -0.6. This becomes apparent when we look at their polling average across the entire election cycle.

As we can see, the biggest swings occur for Die Grüne and the CDU/CSU, whereas the SPD’s stuck around 27% for most of that time. Even though the Green Party wasn’t perceived as the main alternative to the CDU/CSU until this year’s election, I would argue that they could reasonably claim to be exactly that as far back as 2010. The SPD did poll significantly higher and ended up with 2.5 as many votes as their green rivals. I am not arguing that the Greens were more powerful or influential than the SPD. Rather, in hindsight, we can see now that most of the votes were traded between the Greens and the Christian Democrats.
The 2013 election cycle is also a precursor to another phenomenon that has become especially relevant in our current election cycle: the SPD as the main source of Die Grüne’s strength.
Only so much left to go around
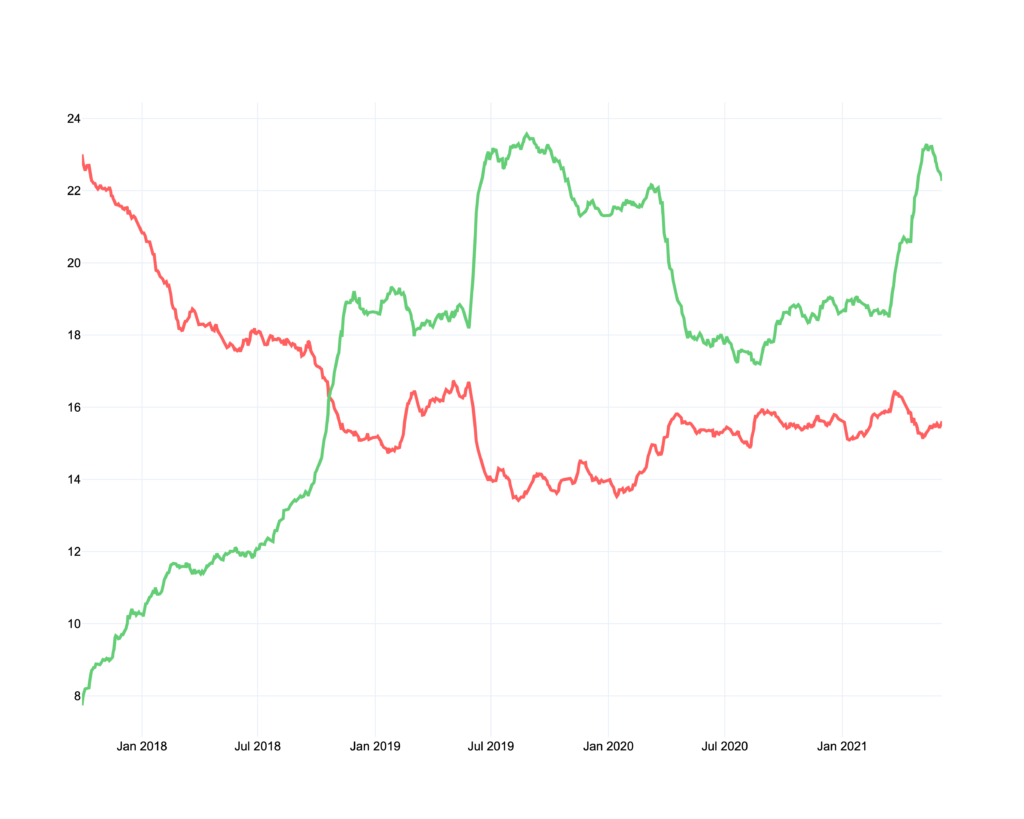
What surprised me the most when I wrote this post was how strong the negative correlation between the Green party and the SPD had become. From 2017 to 2021, it’s -0.9. That means the former partners are now basically in a zero-sum game in their dominance of the left. When we focus on just the Vorcast Polling Average of both parties for the election cycle of 2021, we see a clear mirror pattern (very similar to how the SPD and the CDU/CSU used to look).

Of course, this isn’t a 1:1 relationship. The CDU/CSU is losing ground to the Greens, but it has not been their main source of support. This does not bode well for those that wish to see a left-of-center coalition government in Germany. To make it simple: there are so many left-of-center votes to capture.
In my take back in March on how the election will likely go, I said that the Green party needs more voters to switch over from the SPD. After digging deeper into the data, I’m not sure if they can gain more than they already have.
What the future holds for the SPD and die Grüne
Analyzing trends in politics is hard because at the end of the day, you really don’t have that much data to draw conclusions from. This is important to keep in mind when trying to make predictions about the future.
Still, looking at the chart a the top, we can see two clear trends that have held up for the past 2.5 decades:
- The SPD and the CDU/CSU’s popularity have changed from a negative to a positive correlation. Both parties are increasingly being perceived in a similar way, mostly to the detriment of the former.
- The Greens have managed to distinguish themselves from both the center-left and right successfully which has massively expanded their popularity. They face a tough challenge now in expanding their voter base further.