If there’s one thing I was not in the mood for after the US election in November 2024, it was another high-stakes election – but here we are. The unpopular German “Traffic Light” coalition collapsed and a new federal election is expected to take place on February 23, 2025, seven months before the regularly scheduled election was to take place.
So in the spirit of transparency, let me tell you: I wasn’t planning on working on my model or writing any of this already in December but I went to the virtual basement, picked up my model, blew the dust off, and got it to run again:

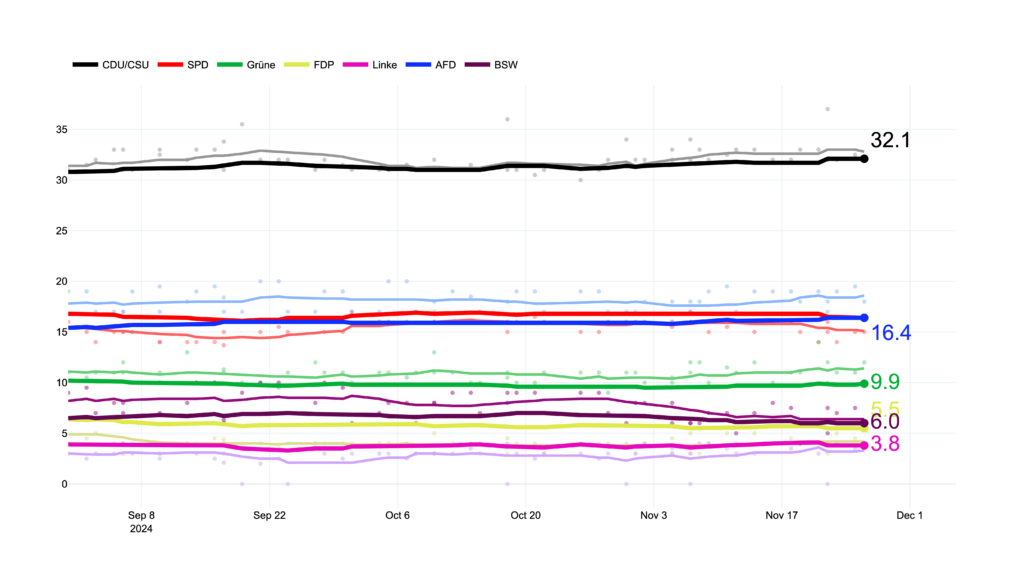
Above is the latest output from today’s date, November 28, 2024 (you can always find the latest predictions on the model page). I have another post in the works with an in-depth look at the state of the race but let me share some quick insights now:
- The SPD are stronger than the current wisdom would suggest
- The AFD and the Greens have inflated polling numbers
- The FDP will cross the all-important 5% threshold
But more on that soon. For now, let’s get into what’s changed with my model.
New election, same-ish model
So what are the main differences between the 2021 and 2025 version of my model?
To tell you the truth, there aren’t many. The biggest change by far is the addition of the new(-ish) lady on the block, Sarah Wagenknecht and her (almost) eponymous party Bündnis Sarah Wagenknecht or BSW for short. Since this is the first time this party is competing in a federal election, the fundamentals part of my model has little historic data to go on. The party is also not a clear continuation of Die Linke (a hard-left party) since it styles itself as a conservative, socialist party. So for the BSW I’ll mostly rely on polling data.
The other big changes are that I changed how important the fundamentals part is in my model. Without going into too many details (you can read the explainer on how my model works here), the fundamentals are the part of my model that takes economic data, past party performance, and some other factors, to predict an election outcome independent of the polls. This part is then mixed with my weighted polling average to produce the final forecast. Another, smaller change in my model are is the updated polling average based on the accuracy of the pollsters in 2021.
I had some plans to expand certain parts of my model, especially in regards to candidate popularity, but I was going to do this work in the spring of 2025 which is now when the election is being held. Also, I think my model did pretty well (if not great) in 2021. I published a post-election post on my model’s performance and looking back on it this week, I came away being a little proud but I did have some doubts still on whether I would publish anything at all.
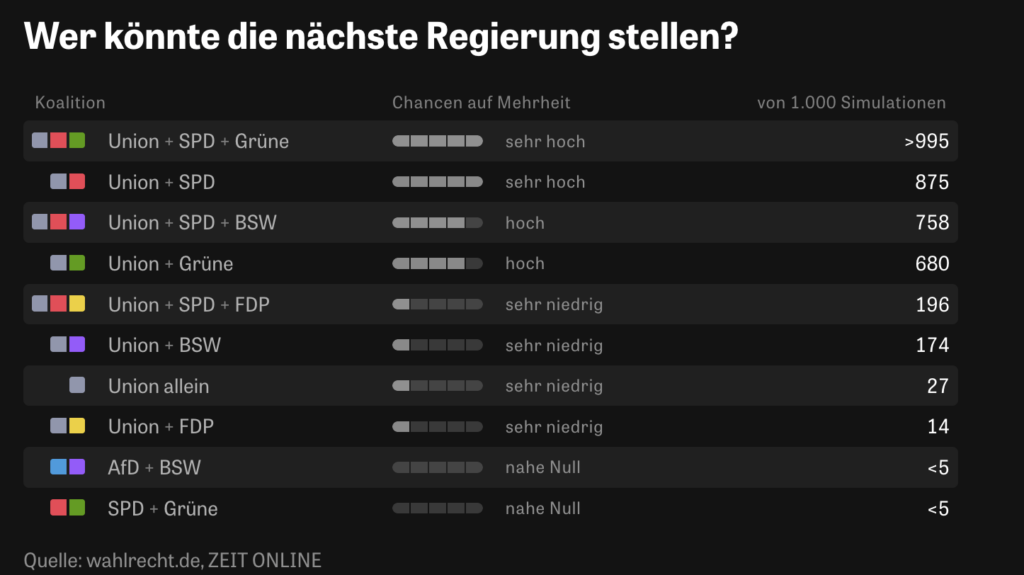
That’s because some pretty big publications already have averages and models out. The Economist is publishing its own averages and Die Zeit now runs simulations to predict the most likely coalition after the election.
What’s unique to Vorcast
I believe my model adds something that no one else provides: a prediction of the actual election results. Let’s unpack that a little.
First of all, Vorcast’s Polling Average is better weighted than the one from either publication based on their 2021 election forecasts.
Secondly, I think my model is a bit more useful because it produces a different output. Whereas The Economist currently only shows polling averages, Die Zeit is doing something very interesting for this election. They adopted a similar approach to the various US 2024 election forecasts from 538 (under new management since 2023), Nate Silver (who used his Silver Bulletin newsletter to publish his model) and The Economist. They are running simulations to determine the most likely post-election coalition partners. I think that’s a valid approach, but I also think it adds little additional value to their polling averages. Anyone who already cares about polling and politics knows that the most likely outcome is that the Christian Democratic/Social Union (or Die Union) is going to come out on top and will have to enter a coalition with the SPD and/or Die Grüne.

In my opinion, you don’t really need 1000 simulations a day to know that this is the most probable outcome of this election.
I think there are certain questions that require a model that actually forecasts vote share:
- Who will the CDU/CSU have to rely on as coalition partners?
- Will the FDP cross the all important 5% threshold and remain in the Bundestag (the German parliament)?
- How strong will the SPD finish and will it come out stronger than the AFD?
- Where does the (notoriously hard to poll) Grüne actually stand?
As it just so happens, I think my model provides answers to these questions because it predicts an actual vote share that incorporates other factors than just polling data. So that’s why I’m back at it this time around.
Also, I love this stuff and I’m having a blast doing it. So if you’re one of the select few readers of this blog, thank you for stopping by, stick around for the next three months, and I promise I’ll provide you with a different perspective on this election you won’t get anywhere else.